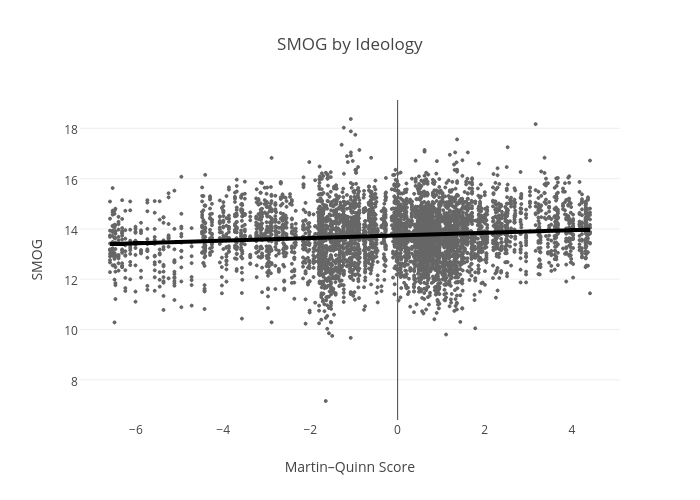
I published a short essay in the Yale Law Journal forum recently: http://www.yalelawjournal.org/pdf/Whalen_PDF_5spbaaeu.pdf. I thought I’d slightly supplement the content available there by posting the interactive charts here:
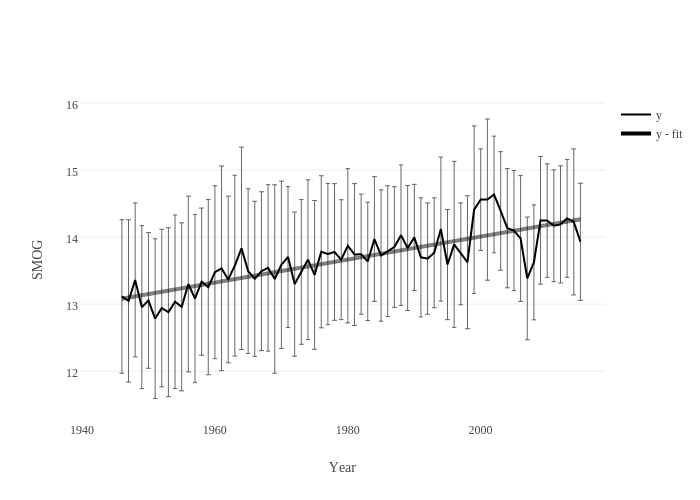
Here’s an overall plot of mean SMOG since 1946:
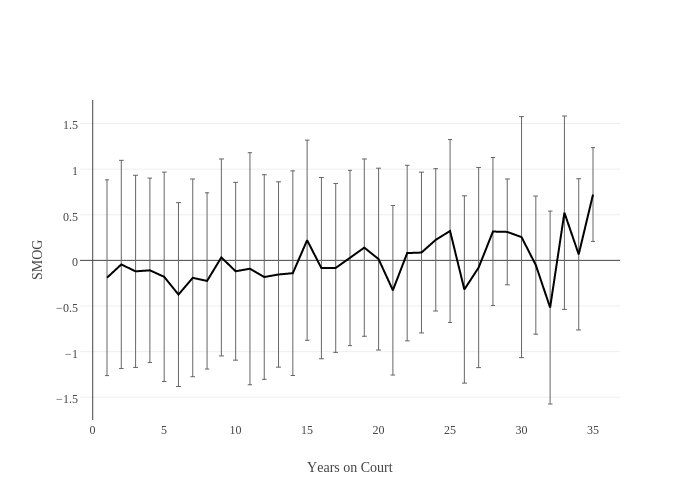
A plot of the mean intra-judge z-score by years of tenure:
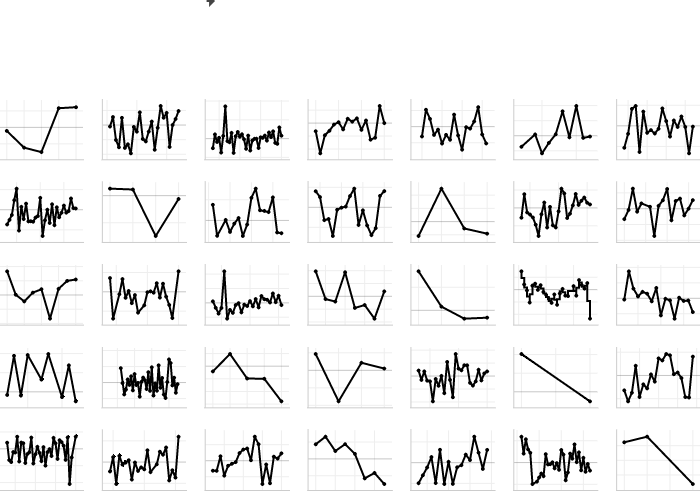
Each judge’s yearly intra-judge SMOG z-score:
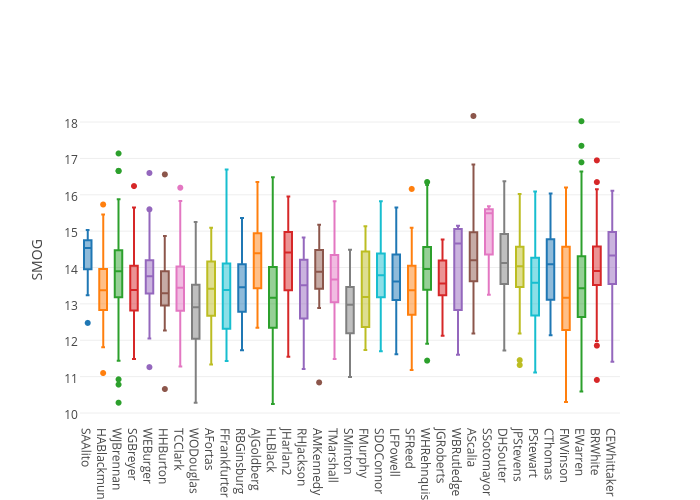
Individual Justice SMOG distributions

