There are hundreds of thousands of papers “published” in LSN e-journals. These papers have the potential to provide a great deal of insight into the production and consumption of legal academic research. I’ve been interested in this data for a while, but it wasn’t until this weekend that I finally found some time to dig a bit into law school research production and impact as reflected in SSRN e-journals.
To do this, I collected metadata on about a quarter of a million articles published in LSN e-journals. I kept track of the author’s stated affiliations and the number of downloads. I then grouped papers by school affiliation for those schools ranking in the U.S. News top 100. More information on how the data was processed can be seen here: https://ssrn.com/abstract=3070187. In the future I also hope to look into top global schools.
The distribution of downloads/school is quite skewed, with a few schools receiving a very high number of downloads, and the majority making up the lefthand (i.e. the low-impact) side of the distribution.

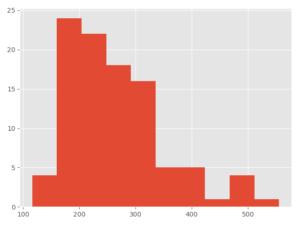
However, if we normalize by the number of papers published, we see a somewhat less-skewed distribution:
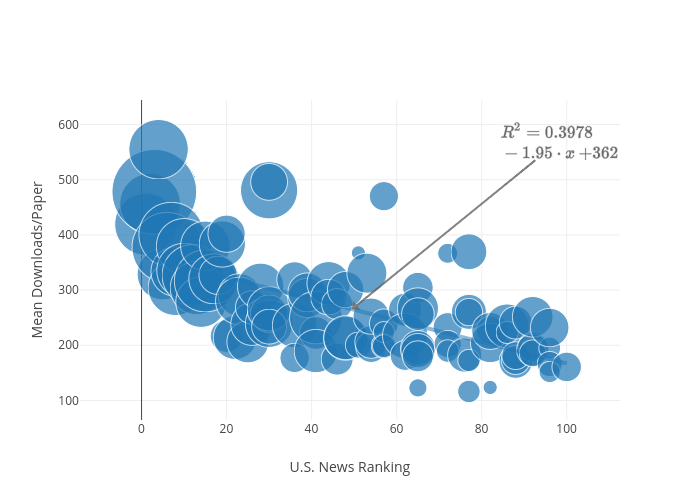
If we look at the correlation between ranking and the other variables we see a fairly uniform negative correlation between most productivity/impact measures and US News ranking, suggesting that as a school’s ranking decreases (i.e. it moves “up” the ranking) the production and impact of scholarship increase. Meanwhile, the number of faculty members also increases.
| US News Rank | |
|---|---|
| Papers | -0.685171 |
| Total Downloads | -0.66488 |
| Downloads/Paper | -0.626963 |
| Papers/Faculty | -0.454281 |
| Downloads/Faculty | -0.625902 |
| Faculty Members | 0.377584 |
We can see this rank/impact correlation in a scatterplot, size here is proportional to the number of papers published by authors affiliated with the institution:
The table below includes data on the 87,988 papers that appear in LSN e-journals and have authors that I was able to (reasonably) accurately associate with an institution that has a law school ranked in the U.S. News top 100. The table is sortable. You’ll notice some fairly substantial differences in ranking depending on how you sort the data, reminding us how sensitive rankings are to their inputs.
| School | Rank | Papers | Downloads | Downloads/Paper | Papers/Faculty | Downloads/Faculty | Downloads/Author | Papers/Author | SSRN Authors |
|---|---|---|---|---|---|---|---|---|---|
| Yale | 1 | 2386 | 1000541 | 419.3 | 34.1 | 14293.4 | 1793.1 | 4.3 | 558 |
| Stanford | 2 | 2268 | 1035652 | 456.6 | 26.4 | 12042.5 | 1928.6 | 4.2 | 537 |
| Harvard | 3 | 4414 | 2110573 | 478.2 | 28.7 | 13705.0 | 2119.0 | 4.4 | 996 |
| University of Chicago | 4 | 2177 | 1208925 | 555.3 | 29.8 | 16560.6 | 3123.8 | 5.6 | 387 |
| Columbia University | 5 | 1626 | 534843 | 328.9 | 11.0 | 3613.8 | 1323.9 | 4.0 | 404 |
| New York University | 6 | 3034 | 1144301 | 377.2 | 22.3 | 8414.0 | 1863.7 | 4.9 | 614 |
| University of Pennsylvania | 7 | 2590 | 1037005 | 400.4 | 32.8 | 13126.6 | 2480.9 | 6.2 | 418 |
| University of Michigan | 8 | 1859 | 564562 | 303.7 | 20.9 | 6343.4 | 1303.8 | 4.3 | 433 |
| University of Virginia | 8 | 1498 | 499758 | 333.6 | 19.2 | 6407.2 | 1952.2 | 5.9 | 256 |
| Duke | 10 | 1900 | 720863 | 379.4 | 24.4 | 9241.8 | 2529.3 | 6.7 | 285 |
| Northwestern | 10 | 1837 | 616213 | 335.4 | 17.8 | 5982.7 | 1975.0 | 5.9 | 312 |
| Berkeley | 12 | 2299 | 751912 | 327.1 | 31.5 | 10300.2 | 1347.5 | 4.1 | 558 |
| Cornell | 13 | 1748 | 530974 | 303.8 | 33.6 | 10211.0 | 1557.1 | 5.1 | 341 |
| University of Texas | 14 | 1579 | 439498 | 278.3 | 17.5 | 4883.3 | 1878.2 | 6.7 | 234 |
| Georgetown | 15 | 2366 | 749051 | 316.6 | 18.2 | 5761.9 | 1770.8 | 5.6 | 423 |
| UCLA | 15 | 1511 | 574555 | 380.2 | 17.2 | 6529.0 | 1934.5 | 5.1 | 297 |
| Vanderbilt | 17 | 1541 | 493785 | 320.4 | 41.6 | 13345.5 | 2789.7 | 8.7 | 177 |
| Washington University in St. Louis | 18 | 901 | 294489 | 326.8 | 14.8 | 4827.7 | 1702.2 | 5.2 | 173 |
| University of Southern California | 19 | 1314 | 503861 | 383.5 | 32.9 | 12596.5 | 1481.9 | 3.9 | 340 |
| University of Iowa | 20 | 655 | 141980 | 216.8 | 20.5 | 4436.9 | 771.6 | 3.6 | 184 |
| University of Notre Dame | 20 | 854 | 343453 | 402.2 | 20.3 | 8177.5 | 2352.4 | 5.8 | 146 |
| Emory | 22 | 1174 | 251069 | 213.9 | 19.6 | 4184.5 | 1249.1 | 5.8 | 201 |
| Boston University | 23 | 1117 | 325274 | 291.2 | 24.8 | 7228.3 | 1659.6 | 5.7 | 196 |
| University of Minnesota | 23 | 1395 | 391257 | 280.5 | 25.4 | 7113.8 | 1493.3 | 5.3 | 262 |
| Arizona State | 25 | 1082 | 223154 | 206.2 | 21.2 | 4375.6 | 1019.0 | 4.9 | 219 |
| Boston College | 26 | 1120 | 266962 | 238.4 | 26.0 | 6208.4 | 1022.8 | 4.3 | 261 |
| University of Alabama | 26 | 683 | 183507 | 268.7 | 18.5 | 4959.6 | 1683.6 | 6.3 | 109 |
| University of California_Irvine | 28 | 1320 | 405150 | 306.9 | 41.3 | 12660.9 | 2485.6 | 8.1 | 163 |
| Washington and Lee | 28 | 433 | 112332 | 259.4 | 13.1 | 3404.0 | 1841.5 | 7.1 | 61 |
| George Washington | 30 | 2015 | 969066 | 480.9 | 27.6 | 13274.9 | 3066.7 | 6.4 | 316 |
| Indiana_Bloomington | 30 | 1388 | 331947 | 239.2 | 26.7 | 6383.6 | 1333.1 | 5.6 | 249 |
| Ohio State | 30 | 837 | 415210 | 496.1 | 18.6 | 9226.9 | 2256.6 | 4.5 | 184 |
| University of Georgia | 30 | 858 | 220777 | 257.3 | 20.0 | 5134.3 | 1346.2 | 5.2 | 164 |
| University of Washington | 30 | 1200 | 319438 | 266.2 | 24.5 | 6519.1 | 1079.2 | 4.1 | 296 |
| University of Wisconsin | 30 | 750 | 175373 | 233.8 | 15.6 | 3653.6 | 863.9 | 3.7 | 203 |
| Fordham | 36 | 1223 | 288645 | 236.0 | 19.4 | 4581.7 | 1016.4 | 4.3 | 284 |
| University of Colorado | 36 | 783 | 249786 | 319.0 | 16.3 | 5203.9 | 1365.0 | 4.3 | 183 |
| Wake Forest | 36 | 528 | 93545 | 177.2 | 12.6 | 2227.3 | 1230.9 | 6.9 | 76 |
| University of California_Davis | 39 | 954 | 272667 | 285.8 | 22.2 | 6341.1 | 1854.9 | 6.5 | 147 |
| University of North Carolina | 39 | 934 | 276308 | 295.8 | 19.1 | 5638.9 | 1439.1 | 4.9 | 192 |
| William and Mary | 41 | 655 | 145634 | 222.3 | 14.9 | 3309.9 | 1300.3 | 5.8 | 112 |
| George Mason | 41 | 1706 | 426845 | 250.2 | 48.7 | 12195.6 | 1749.4 | 7.0 | 244 |
| University of Florida | 41 | 1155 | 219036 | 189.6 | 17.2 | 3269.2 | 1223.7 | 6.5 | 179 |
| University of Illinois | 44 | 1157 | 361494 | 312.4 | 28.2 | 8816.9 | 1882.8 | 6.0 | 192 |
| University of Utah | 44 | 783 | 224945 | 287.3 | 25.3 | 7256.3 | 1956.0 | 6.8 | 115 |
| Brigham Young | 46 | 592 | 162554 | 274.6 | 22.8 | 6252.1 | 1451.4 | 5.3 | 112 |
| Southern Methodist | 46 | 627 | 109639 | 174.9 | 16.1 | 2811.3 | 1218.2 | 7.0 | 90 |
| Florida State | 48 | 1171 | 248764 | 212.4 | 28.6 | 6067.4 | 1715.6 | 8.1 | 145 |
| University of Arizona | 48 | 814 | 244892 | 300.9 | 21.4 | 6444.5 | 1353.0 | 4.5 | 181 |
| University of Maryland | 48 | 1190 | 254447 | 213.8 | 24.3 | 5192.8 | 856.7 | 4.0 | 297 |
| Baylor | 51 | 123 | 45208 | 367.5 | 4.4 | 1614.6 | 1102.6 | 3.0 | 41 |
| Tulane | 51 | 418 | 83761 | 200.4 | 9.3 | 1861.4 | 872.5 | 4.4 | 96 |
| Temple | 53 | 986 | 326059 | 330.7 | 17.3 | 5720.3 | 1781.7 | 5.4 | 183 |
| University of California_Hastings | 54 | 584 | 114934 | 196.8 | 9.3 | 1824.3 | 1321.1 | 6.7 | 87 |
| University of Connecticut | 54 | 655 | 134930 | 206.0 | 14.9 | 3066.6 | 827.8 | 4.0 | 163 |
| University of Houston | 54 | 808 | 204289 | 252.8 | 13.7 | 3462.5 | 1469.7 | 5.8 | 139 |
| Seton Hall | 57 | 515 | 123414 | 239.6 | 15.6 | 3739.8 | 1738.2 | 7.3 | 71 |
| University of Kentucky | 57 | 389 | 77419 | 199.0 | 17.7 | 3519.0 | 850.8 | 4.3 | 91 |
| University of Nebraska | 57 | 275 | 61556 | 223.8 | 10.6 | 2367.5 | 809.9 | 3.6 | 76 |
| University of Richmond | 57 | 322 | 63936 | 198.6 | 9.2 | 1826.7 | 1014.9 | 5.1 | 63 |
| University of Tennessee | 57 | 522 | 245448 | 470.2 | 19.3 | 9090.7 | 3068.1 | 6.5 | 80 |
| Case Western | 62 | 676 | 178787 | 264.5 | 18.3 | 4832.1 | 1596.3 | 6.0 | 112 |
| Rutgers | 62 | 1266 | 275037 | 217.2 | 16.9 | 3667.2 | 1041.8 | 4.8 | 264 |
| University of Nevada | 62 | 549 | 99679 | 181.6 | 19.6 | 3560.0 | 1277.9 | 7.0 | 78 |
| Georgia State | 65 | 737 | 143834 | 195.2 | 12.9 | 2523.4 | 978.5 | 5.0 | 147 |
| Loyola LA | 65 | 573 | 174453 | 304.5 | 9.7 | 2956.8 | 2076.8 | 6.8 | 84 |
| Northeastern | 65 | 721 | 137301 | 190.4 | 20.6 | 3922.9 | 1144.2 | 6.0 | 120 |
| Pennsylvania State_Dickinson | 65 | 203 | 24920 | 122.8 | 11.3 | 1384.4 | 1132.7 | 9.2 | 22 |
| University of Kansas | 65 | 591 | 106362 | 180.0 | 19.7 | 3545.4 | 1363.6 | 7.6 | 78 |
| University of Missouri | 65 | 1043 | 278224 | 266.8 | 34.8 | 9274.1 | 2060.9 | 7.7 | 135 |
| Cardozo | 65 | 655 | 168034 | 256.5 | 11.3 | 2897.1 | 2301.8 | 9.0 | 73 |
| Pepperdine | 72 | 517 | 120432 | 232.9 | 14.4 | 3345.3 | 1852.8 | 8.0 | 65 |
| St. John’s | 72 | 454 | 91952 | 202.5 | 12.3 | 2485.2 | 1242.6 | 6.1 | 74 |
| University of Cincinnati | 72 | 311 | 58953 | 189.6 | 12.0 | 2267.4 | 830.3 | 4.4 | 71 |
| University of Oklahoma | 72 | 244 | 89481 | 366.7 | 8.1 | 2982.7 | 1315.9 | 3.6 | 68 |
| University of Denver | 76 | 717 | 130615 | 182.2 | 9.6 | 1741.5 | 1044.9 | 5.7 | 125 |
| University of Arkansas_Fayetteville | 77 | 304 | 52452 | 172.5 | 11.3 | 1942.7 | 718.5 | 4.2 | 73 |
| University of Miami | 77 | 753 | 196225 | 260.6 | 9.7 | 2515.7 | 1102.4 | 4.2 | 178 |
| University of New Mexico | 77 | 310 | 36048 | 116.3 | 9.7 | 1126.5 | 396.1 | 3.4 | 91 |
| University of San Diego | 77 | 791 | 292267 | 369.5 | 14.4 | 5313.9 | 3699.6 | 10.0 | 79 |
| Villanova | 77 | 460 | 119690 | 260.2 | 15.3 | 3989.7 | 1554.4 | 6.0 | 77 |
| Loyola_Chicago | 82 | 470 | 106812 | 227.3 | 10.0 | 2272.6 | 1722.8 | 7.6 | 62 |
| Pennsylvania State_University Park | 82 | 958 | 195698 | 204.3 | 28.2 | 5755.8 | 1322.3 | 6.5 | 148 |
| University of Pittsburgh | 82 | 840 | 189728 | 225.9 | 22.7 | 5127.8 | 1290.7 | 5.7 | 147 |
| University of Tulsa | 82 | 124 | 15325 | 123.6 | 6.9 | 851.4 | 528.4 | 4.3 | 29 |
| American University | 86 | 1184 | 278334 | 235.1 | 24.2 | 5680.3 | 983.5 | 4.2 | 283 |
| University of Oregon | 86 | 305 | 68106 | 223.3 | 10.9 | 2432.4 | 840.8 | 3.8 | 81 |
| Brooklyn Law | 88 | 663 | 159763 | 241.0 | 11.1 | 2662.7 | 2754.5 | 11.4 | 58 |
| Indiana_Indianapolis | 88 | 683 | 116366 | 170.4 | 18.0 | 3062.3 | 1003.2 | 5.9 | 116 |
| St. Louis University | 88 | 510 | 88329 | 173.2 | 11.6 | 2007.5 | 1162.2 | 6.7 | 76 |
| University of South Carolina | 88 | 475 | 86071 | 181.2 | 11.9 | 2151.8 | 819.7 | 4.5 | 105 |
| Chicago_Kent | 92 | 535 | 105582 | 197.3 | 8.2 | 1624.3 | 1852.3 | 9.4 | 57 |
| Syracuse | 92 | 638 | 122182 | 191.5 | 14.5 | 2776.9 | 860.4 | 4.5 | 142 |
| Texas A&M | 92 | 1018 | 256164 | 251.6 | 29.9 | 7534.2 | 1407.5 | 5.6 | 182 |
| University of Louisville | 92 | 445 | 82513 | 185.4 | 20.2 | 3750.6 | 1500.2 | 8.1 | 55 |
| Louisiana State | 96 | 293 | 57141 | 195.0 | 10.1 | 1970.4 | 664.4 | 3.4 | 86 |
| Michigan State | 96 | 913 | 211915 | 232.1 | 18.3 | 4238.3 | 1059.6 | 4.6 | 200 |
| Stetson | 96 | 388 | 64445 | 166.1 | 10.5 | 1741.8 | 947.7 | 5.7 | 68 |
| West Virginia University | 96 | 275 | 41686 | 151.6 | 9.5 | 1437.4 | 595.5 | 3.9 | 70 |
| Florida International | 100 | 535 | 86036 | 160.8 | 18.4 | 2966.8 | 1000.4 | 6.2 | 86 |
Caveats & Details: There are a few caveats to consider here. The data is not strictly limited to law school faculty. I examined any paper that appeared in an LSN e-journal. I then tried to ascertain which institution the author(s) were affiliated with. This will lead to some over-inclusion beyond law school faculty, which will be exacerbated for larger institutions. When a faculty member from another school/department (e.g. business school or economics) posts a paper to an LSN e-journal, their work will be attributed to their corresponding schools. The data will also include student papers, etc.
When a co-authored paper listed authors from multiple institutions, each institution was credited with a full paper and the full number of downloads for that work. A case can be made for fractional counting, but that isn’t the norm in impact assessment, so I didn’t do it here.
In addition to error that may have been introduced in the school identification stage (of which there is definitely some) this data is also affected by how people use SSRN. Schools where many faculty members use it to upload lots of papers will do better than others.
For a somewhat more full discussion of the data collection process see: https://ssrn.com/abstract=3070187